Beyond Test Scores: A Tutoring Progress Dashboard That Changes the Next Lesson


Beyond Test Scores: A Tutoring Progress Dashboard That Changes the Next Lesson
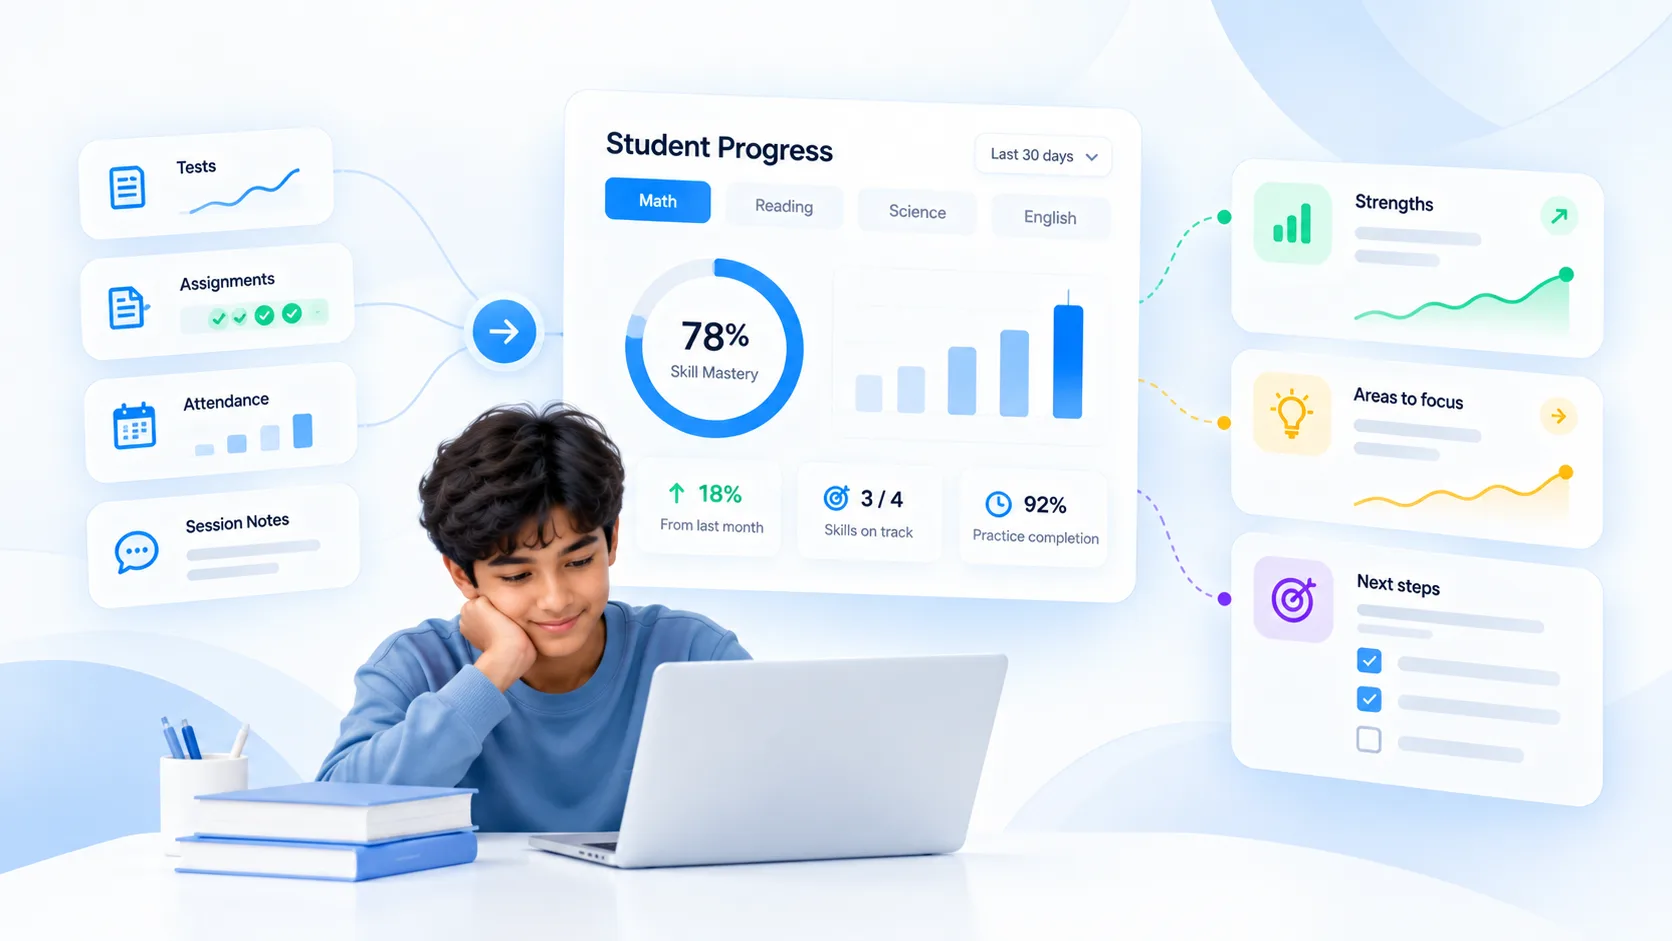
A tutoring dashboard can display dozens of numbers and still fail its most important test: does it change what the tutor does next? A student might have a higher quiz score, more completed assignments, and perfect attendance, yet still be unable to solve a related problem independently a week later. That is why **tutoring progress tracking** should combine learning evidence with the conditions under which learning happened—not reduce progress to a single percentage.
The Harvard Strategic Data Project's high-dosage tutoring toolkit emphasizes consistent variables, data collection protocols, and dashboards for monitoring tutoring implementation. The Institute of Education Sciences' guidance on assessment makes a complementary point: choose the assessment based on the decision you need to make. A benchmark score may tell you whether a student is on track; a quick formative probe may be more useful for tomorrow's lesson.
Start with the instructional decision
Before adding a chart, write down the decision it should support. Should the tutor reteach a concept? Increase difficulty? Return to a prerequisite? Change pacing? Reduce homework volume? Speak with the family about attendance? Each decision requires different evidence. A dashboard that cannot answer any of those questions is likely measuring activity rather than learning.
For a tutoring business, separate three layers: learning outcomes, learning process, and program delivery. Outcome data describes what the student can do. Process data describes how the student works. Delivery data describes whether the planned tutoring actually happened. Keeping these layers separate prevents a missed lesson from being mislabeled as low mastery or a completed assignment from being mistaken for understanding.
The seven measures worth tracking
Measure | What it answers | Caution |
|---|---|---|
Baseline skill performance | Where did the student start? | Use comparable tasks and record conditions |
Current independent accuracy | What can the student do without help? | Separate prompted from unprompted work |
Delayed retention | Does the learning last? | Retest after time has passed |
Transfer to new problems | Can the student choose and apply a method? | Avoid repeating identical items |
Assignment completion | Is practice being attempted? | Completion is not mastery |
Attendance and instructional dosage | How much instruction occurred? | Do not confuse planned and delivered hours |
Error patterns and next action | What should change in instruction? | Use a small, consistent taxonomy |
You do not need all seven on every student-facing screen. A tutor's working view can be detailed; the parent's view should emphasize goals, evidence, and next steps. Program directors need aggregate trends and exception alerts, not an endless list of individual quiz scores.
Establish a baseline that you can revisit
A baseline should be short enough to use and precise enough to compare. Define the target skill, task difficulty, time limit if relevant, allowed tools, and whether hints were given. Record the date and the student's reasoning, not just the score. If the baseline is a long standardized test, use it to identify broad priorities and supplement it with smaller diagnostic tasks for the skills that matter most.
For example, “60% on algebra” is not a useful baseline by itself. “Correctly solved three of five linear equations independently; errors came from distributing negative signs” identifies an instructional target. Two weeks later, a comparable set can reveal whether the misconception persists. The comparison is more defensible because the tasks measure the same construct.
Track mastery as evidence, not a permanent label
A dashboard should not declare a student “mastered” after one easy correct response. Define a local mastery rule such as repeated independent success across comparable items and a delayed check. The rule can vary by subject, age, and risk level; it is an instructional convention, not a universal psychometric standard. Record what evidence qualified the skill as ready to advance.
Keep room for uncertainty. A student might demonstrate accurate procedures but struggle with novel applications. Another might understand the concept but make time-pressure errors. Those students need different next lessons even if their overall percentages match. A strong dashboard exposes that difference rather than hiding it in a composite score.
Make error patterns actionable
Use a small number of categories that tutors can apply consistently: concept, reading/interpretation, strategy selection, execution, pacing, and self-checking. Avoid an enormous taxonomy that consumes more time than it saves. The point is to connect an error to a teaching response.
Pattern | Likely next lesson | Evidence to collect afterward |
|---|---|---|
Repeated prerequisite error | Brief explicit reteach and scaffolded examples | Independent prerequisite probe |
Correct blocked practice, weak mixed practice | Interleaved discrimination tasks | Mixed-set accuracy and explanation |
Accurate immediately, weak after a week | Spaced retrieval | Delayed unprompted response |
High accuracy, slow execution | Fluency practice without sacrificing reasoning | Time and error rate together |
Strong knowledge, inconsistent attendance | Adjust delivery plan | Completed versus planned sessions |
Show progress in a timeline, not just a snapshot
The dashboard should make the sequence visible: baseline, intervention, practice, delayed check, and next decision. A time series helps tutors avoid overreacting to one unusually good or bad day. Annotate major changes such as a new curriculum unit, extended absence, altered accommodations, or a switch from untimed to timed work. Without that context, a chart can create false confidence.
A practice assignment and score-report system can centralize performance evidence, while a tutoring calendar can provide attendance context. Those are inputs. The professional interpretation still belongs to the tutor, who knows whether the task was independent, appropriately difficult, and representative of the target skill.
Use two views: tutor decisions and manager oversight
Tutors need student-level questions: What are the top two unresolved skills? What happened on the last delayed check? Which error is recurring? What should I assign next? Managers need program-level questions: Which students have no recent baseline? Who is receiving fewer sessions than planned? Which tutors are documenting next steps? Where are progress reviews overdue?
Do not rank tutors by raw student score growth without accounting for starting points, student needs, test comparability, and assignment patterns. Such rankings can reward easier caseloads and discourage work with students who need the most help. Use aggregated data for support and investigation, not as an automatic verdict on tutor quality.
A sample 15-minute weekly review
Open the student's current goal and last baseline comparison.
Review independent performance, delayed retrieval, and one representative error.
Check attendance and assignment completion for context.
Select one instructional adjustment for the next lesson.
Record what evidence will show whether the adjustment worked.
This is a decision cycle, not a reporting ritual. If the tutor cannot name a change after reviewing the data, the dashboard may need fewer metrics or clearer definitions. If the student is progressing well, “continue the current plan and retest next week” is a legitimate decision.
Protect data quality and student privacy
A beautiful dashboard built on inconsistent definitions is worse than a simple table. Agree on what counts as a completed session, independent attempt, correct response, reassessment, and mastery check. Train tutors on those definitions. Limit access to the information staff need, and avoid sharing identifiable student records in unsecured exports or public AI tools.
Also distinguish observation from inference. “Student attempted six of eight assigned items” is observed. “Student lacks motivation” is an interpretation that may be unfair or wrong. Prefer precise descriptions and ask questions before assigning causes. This improves both teaching decisions and family communication.
Roll out the dashboard in four weeks
In week one, choose a small set of goals and the seven core fields, then document definitions. In week two, pilot the system with a few tutors and inspect whether it changes lesson planning. In week three, add a manager view for missing data, dosage, and overdue reviews. In week four, compare the time spent entering data with the value of the decisions it supports. Remove fields nobody uses and refine those that produce ambiguous results.
Frequently asked questions
How often should tutoring progress be measured?
Use short formative checks as often as needed for instructional decisions, with less frequent comparable reviews for broader growth. More testing is not automatically better; the assessment should answer a question.
Is a higher test score enough to prove tutoring worked?
Not by itself. Scores can change with task difficulty, familiarity, time, and many outside influences. Use comparable evidence and interpret changes cautiously, especially when claiming a causal effect.
What should parents see?
A concise summary of the goal, the student's current evidence, what improved, what remains difficult, and the next action. Raw data can be available when helpful, but interpretation should come first.
A useful tutoring progress dashboard is not a trophy wall of green percentages. It is a decision tool. When every metric has a definition and every review ends with a next step, progress tracking becomes part of instruction rather than paperwork that happens after it.
Other Stories